1. Visualization
The bounce easing function’s graph looks like this:
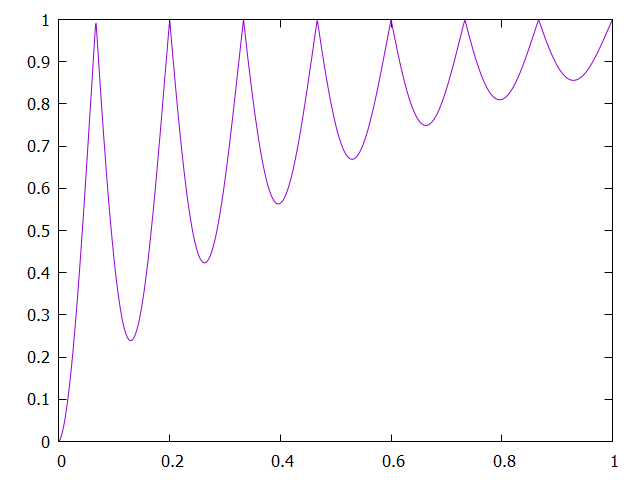
The fact that it starts at 0 and bounces against the 1-ceiling might seem unintuitive to you, but don’t forget that the starting position corresponds to 0 and the ending position to 1.
2. Parameters
The animation can be parameterized in two ways:
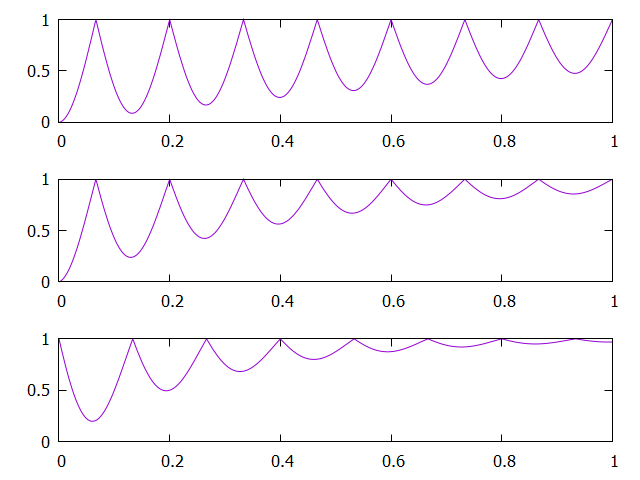
-
Number of bounces
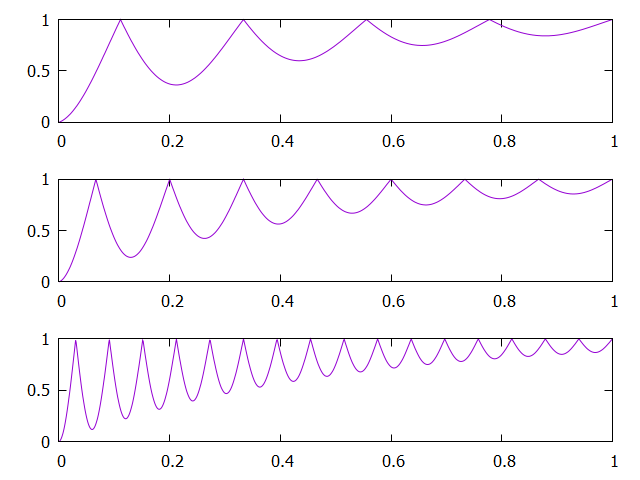
-
Bounce absorption